How is tax calculated and visualized?
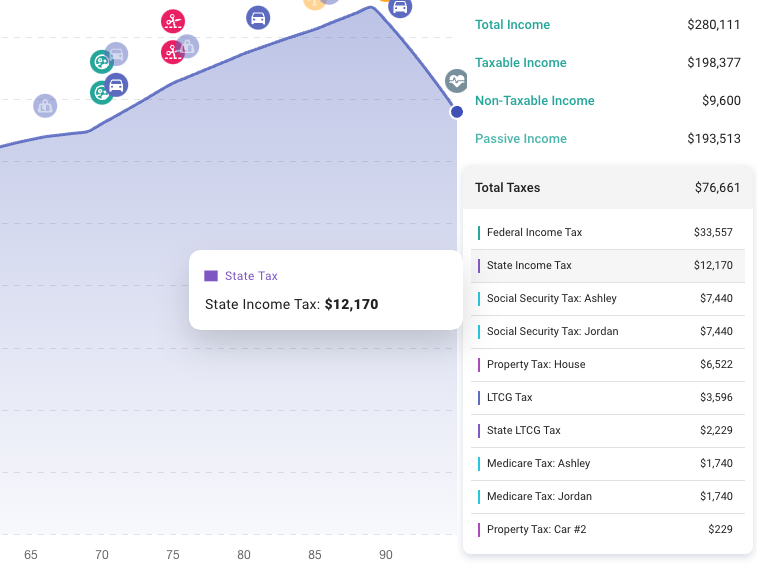
At the end of each simulated year, ProjectionLab computes your total tax liability based on everything that happened in that year. Total tax liability is reflected in the Total Taxes expansion panel in the yearly summary pane:
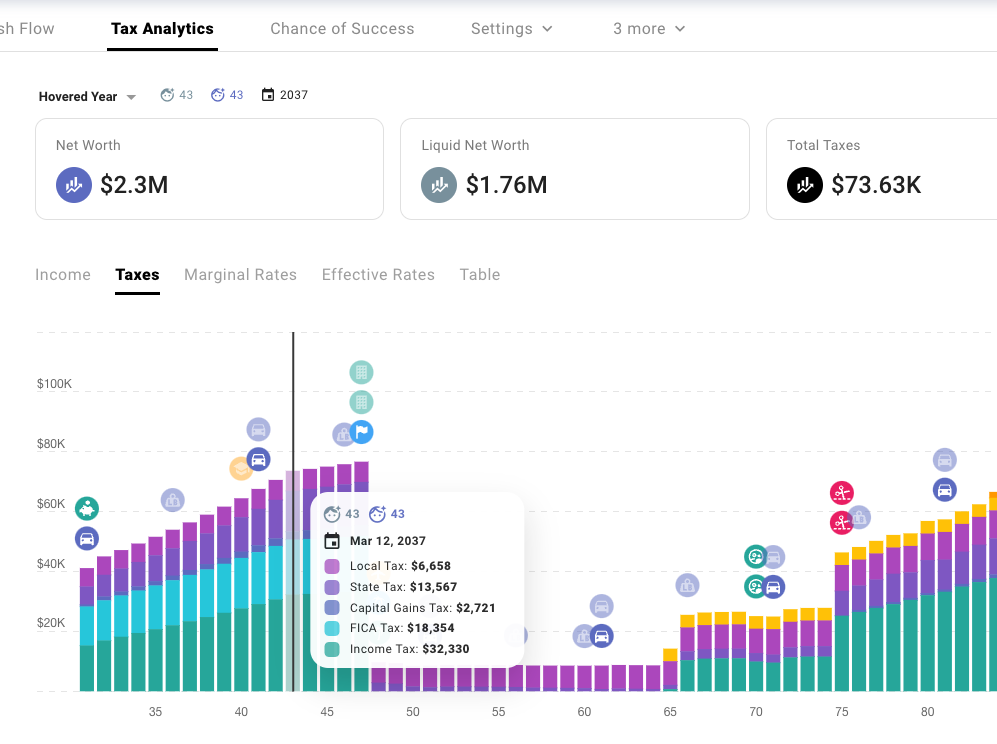
Total tax liability is also used for the breakdowns and visualizations on the Tax Analytics page:
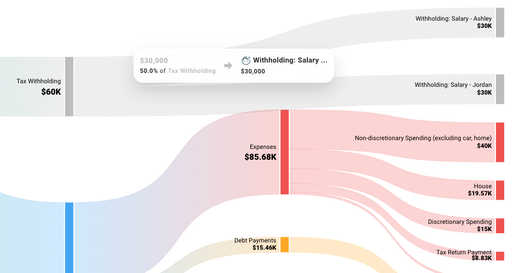
However, total tax liability is not what you’ll see in the Sankey cash-flow chart. That chart depicts the underlying flows that occur like tax withholding, tax return payments and refunds.
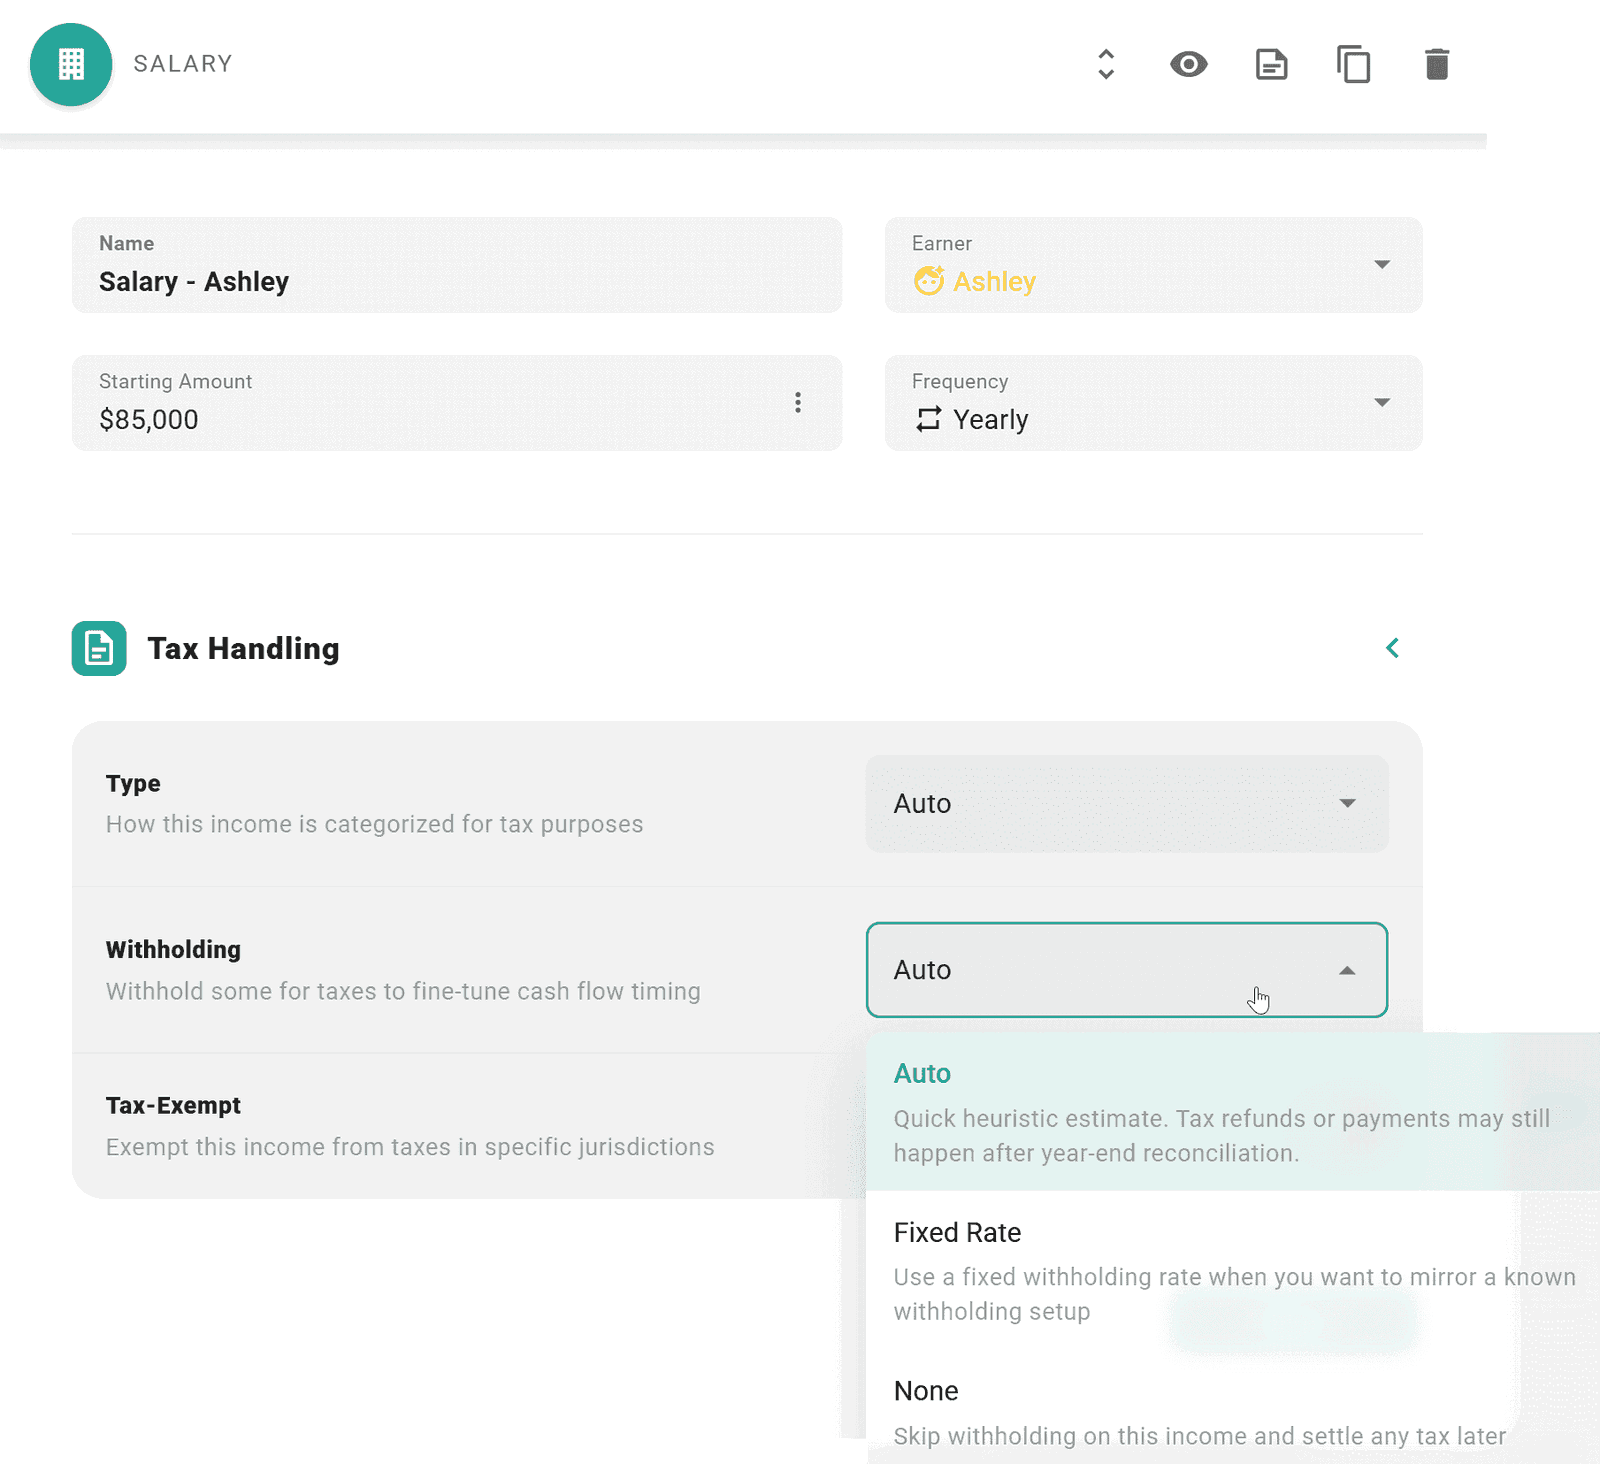
While tax liability is computed at the end of each simulated year, whether or not any tax actually gets collected and remitted during that year depends on how you have set up tax withholding on your income sources. The Tax Handling subsection of the Income form lets you choose between Auto (a heuristic estimate), a Fixed Rate, or None (skip withholding and settle any tax later).
For example:
After each year, ProjectionLab reconciles the total computed tax liability with how much tax withholding actually occurred, and then in the subsequent year you’ll either see a tax return payment or refund. This is mainly to try to mirror how things work in the real world, particularly in the US.
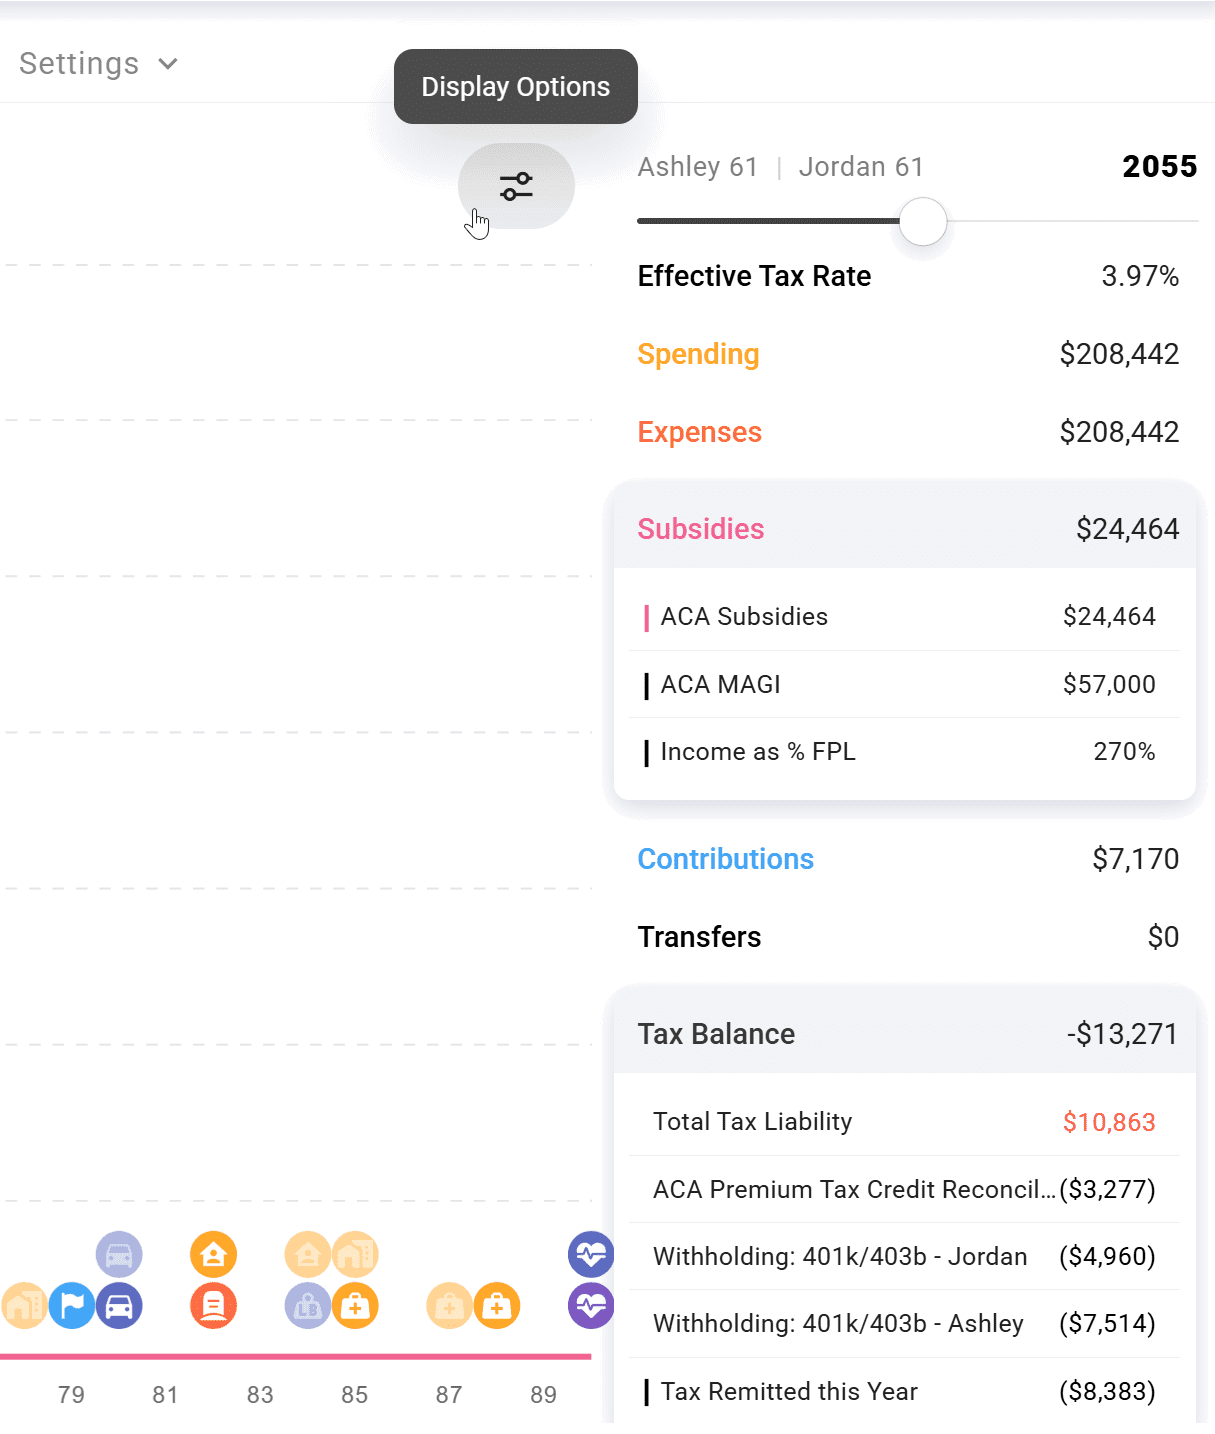
The Tax Balance panel in the yearly summary pane brings together the year’s total tax liability, the withholding actually remitted during the year, and any reconciliation entries from the prior year’s true-up. It shows the net effect for each year – whether a refund is coming or you’ll owe at filing time.
Note
If you don’t see Tax Balance in the yearly summary pane:
Display Options -> Metric Settings -> Auto Filter -> Off.
Display Options -> Metrics -> Find and Enable Tax Balance.
If you need to model a tax return payment that you know you’ll be paying in the real world in the first simulated year based on what happened in the past, just add a one-time expense.
Additional Tips
- ProjectionLab’s Tax Analytics and Quick Tips videos walk through how taxes are calculated in more detail.
- Join our Discord Community for examples and discussion about first‐year tax scenarios.
Related
Disclaimer: The content, tools, and resources on ProjectionLab.com are intended solely for informational and educational purposes and should not be construed as professional financial or investment advice. Our materials are designed to provide general guidance and are based on the input and data provided by users. ProjectionLab makes no guarantee of the accuracy, completeness, or applicability of this content to individual circumstances. Effective financial planning and investment involve comprehensive consideration of a wide array of personal financial factors. The tools and resources available on ProjectionLab are aimed at helping users develop an understanding of their financial trajectory. However, they should not be solely relied upon for creating a complete financial plan. We strongly recommend consulting a financial services professional who can provide personalized advice based on your unique financial situation before making any significant financial decisions. While we endeavor to keep the information on ProjectionLab current and accurate, the content may differ from that found on other financial institutions, service providers, or specific product sites. All content and tools on ProjectionLab are provided without any guarantees or warranties of any kind.